
Reach out to us for a competitive pricing quote, tailored specifically to meet your unique needs.

- Access Pre-Built Course With Unlimited Customizability
- Completely Customize Questions, Lessons, Problem Sets, Modules, or Courses
- Build Custom Lessons and Problem Sets Using Our Large Collection of Open Educational Resources - OER (OpenStax, OpenIntro, etc.)
- Easily Share Created Resources with Colleagues
- Assign Math Review Assignments to help Strength Topic Specific Prerequisite Math Skills
- Access Large Collection of Reports and Real-Time Learning Graphics
- Assignments Provide Instant Feedback and Hints for Struggling Students
- Support for both the TI-83/84 or R
- Embedded R Computing Environment
- Assign Over 5,000+ Statistics Question Items
- Access 70+ Lessons
- Design Activities with Our 1,000+ Datasets
- Collaborate with Colleagues on Our Community Message Board
- Access Help Quickly Through Live Chat
How does this course differ from other introductory statistics classes?
This class is different in that we provide students an opportunity to learn all the topics typically found in an introductory statistics course but with an emphasis on using the R programming language to complete all activities.
Do my students need to have any experience using R to take this class?
No. Actually, this course has been designed to provide a basic introduction to R. This course includes materials to slowly introduce students with the use of R.
How do students access the R with this course?
Access to R is extremely easy for all students as it is seamlessly built into our assignments using our custom-built R interface called RDojo. The RDojo interface provides a minimalistic and unintimidating interface to provide introductory students an easy-to-use platform before moving on to more advanced interfaces such as RStudio.
What additional resources do my students need to buy?
Nothing :) This course provides everything your students will need to complete the assignments. This includes lessons (textbook lessons with embedded questions), R computing environment, problem sets, labs, etc. The important thing to note is that with this course, students don't need to buy any additional statistics package or statistics capable calculator as Key2STATS provides RDojo, an easy-to-use R programming environment with this course.
Can I edit the course to meet my needs?
Yes, teachers begin by creating their own copy of the course shown above. Once that is done, they can easily modify/reorder/add/delete any and all components of their course. This includes everything on the order of entire modules all the way down to individual questions.
Can I create my own questions, lessons, problem sets, or modules?
Absolutely! All teacher accounts provide an extreme amount of flexibility to create unique learning resources to match their individual needs. These resources can be individual questions all the way up to entire courses.
Why use R instead of the TI-83/84 or Excel?
There are many reasons to choose R over the TI-83/84 or Excel. However, two important considerations are cost and ease of use for statistical analysis purposes. Regarding cost, R is open-source and thus is free, while both the TI and Excel are not. Regarding ease of use, Key2STATS takes the view that conducting statistical analysis in R is easier to learn. The following is a comparison of the three tools as it applies to conducting basic linear regression analysis.
| R Code |
TI-83/84 Instructions |
Excel |
## Enter the data into R
x <- c(3,5,8,10)
y <- c(7,8,14,18)

## Construct a scatterplot
plot(x,y)

## Built and view output of the linear model
model <- lm(y~x)
model

## Attach the fitted line to the scatterplot
abline(model)
|
1. From the home screen press the [STAT] key to go to the statistics menu.
2. Next press the [1] key to go the edit menu.
3. In the edit menu enter the data {3,5,8,10} in the L1 list and {7,8,14,18} in the L2 list, pressing enter after each entry to move down along the list.
4. First press the [STAT] key to enter the statistics menu.
5. Then press the [right arrow] key to reach the CALC menu and then press the [4] key to select LinReg(ax+b)
6. Next in order input which lists to use for the regression, press the [2nd] key, then the [1] key to bring up your L1 list, next press the [,] key to separate your two lists and last press the [2nd] key and the [2] key to bring up your L2 list. Press [,] [VARS] and scroll to the right, now press [1] [1].
7. Press the [ENTER] key to perform the regression calculation
8. Press then [2nd] key and then press the [STAT PLOT] key to enter the stat plot menu, next press the [1] key to enter plot 1
9. In the next menu highlight ON and then press the [ENTER] key to turn on the stat plot, and be sure that Xlist is L1 and Ylist is L2
10. Next press the [ZOOM] key and then press the [9] key to set up ZoomStat |
The following link provides an in-depth look at conducting linear regression analysis using Excel.
Regression - Excel
|
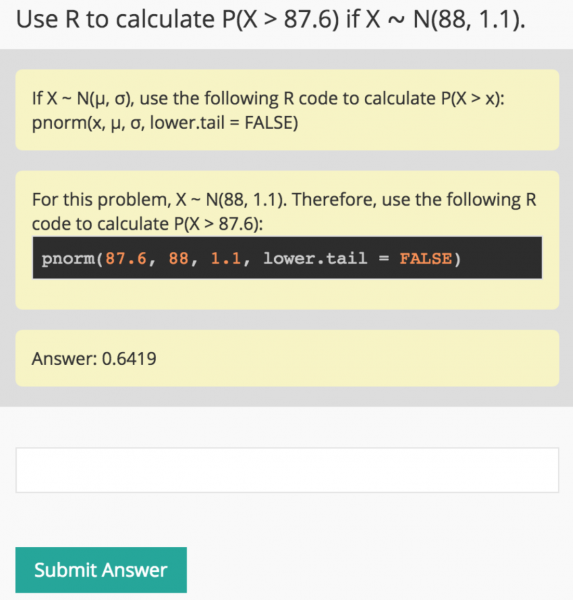
What if a student is attempting a problem, but doesn't know which R code to use?
In instances where a student doesn't know which code to use, the student can click on the hints button. The button will walk the student through how to complete the assignment. In addition, for students that require R, the students will be provided with the correct R code so that they can learn how to complete the problem correctly for a similar problem. The example below shows an example of hints, shown in yellow, for a normal distribution question.
Can my colleagues and I collaborate to make our own custom course?
Yes! Every learning component is, by default, shareable to colleagues across the hall or across the world.
Reach out to us for a competitive pricing quote, tailored specifically to meet your unique needs.
- Access Pre-Built Course With Unlimited Customizability
- Completely Customize Questions, Lessons, Problem Sets, Modules, or Courses
- Build Custom Lessons and Problem Sets Using Our Large Collection of Open Educational Resources - OER (OpenStax, OpenIntro, etc.)
- Easily Share Created Resources with Colleagues
- Assign Math Review Assignments to help Strength Topic Specific Prerequisite Math Skills
- Access Large Collection of Reports and Real-Time Learning Graphics
- Assignments Provide Instant Feedback and Hints for Struggling Students
- Support for both the TI-83/84 or R
- Embedded R Computing Environment
- Assign Over 5,000+ Statistics Question Items
- Access 70+ Lessons
- Design Activities with Our 1,000+ Datasets
- Collaborate with Colleagues on Our Community Message Board
- Access Help Quickly Through Live Chat
For this course, what additional resources do my students need to buy?
Other than a TI-83/84 calculator, nothing else is required. This course provides everything your students will need to complete the assignments. This includes lessons (textbook lessons with embedded questions), problem sets, labs, etc.
Can I edit the course to meet my needs?
Yes, teachers begin by creating their own copy of the course shown above. Once that is done, they can easily modify/reorder/add/delete any and all components of their course. This includes everything on the order of entire modules all the way down to individual questions.
Can I create my own questions, lessons, problem sets, or modules?
Absolutely! All teacher accounts provide an extreme amount of flexibility to create unique learning resources to match their individual needs. These resources can be individual questions all the way up to entire courses.
Can my colleagues and I collaborate to make our own custom course?
Yes! Every learning component is, by default, shareable to colleagues across the hall or across the world.
